Lactate had a bad reputation for years. It was the “waste product” that made your muscles burn, the stuff you were supposed to avoid. That view is outdated. Research from the past two decades has shown that lactate is not the enemy, it is an essential fuel. Your heart, your brain and your slow-twitch muscle fibers actively use lactate as an energy source. On top of that, it acts as a signaling molecule that drives adaptations in your body.
That shift in understanding has also changed how coaches and athletes look at testing. A lactate test is no longer reserved for Olympic-level athletes. It is the most informative tool available to you as an endurance athlete, more precise than heart rate alone, more concrete than a VO2max test, and directly translatable into your daily training.
What happens physiologically?
Your body produces lactate continuously, even when you’re sitting on the couch. At rest, roughly 0.8 to 1.2 mmol/L of lactate circulates in your blood. That’s normal and healthy. Lactate is a byproduct of glycolysis, the process that breaks down glucose for energy. Even at low intensity, this process runs in the background.
As you increase intensity, lactate production increases too. At the same time, your body works on clearance: your liver, your heart and your inactive muscles absorb lactate and use it as fuel. Up to a certain point, that clearance keeps pace with production. Your blood lactate rises slightly but stays stable.
That tipping point is what makes this physiologically interesting. Once production outpaces clearance, lactate starts accumulating in the blood. This doesn’t happen suddenly, but in two recognizable phases: the aerobic threshold and the anaerobic threshold. Beyond the anaerobic threshold, your body can no longer keep up with the rate of production. Lactate rises exponentially, your breathing quickens sharply, and you know you can only hold that intensity for a limited time.
The aerobic and anaerobic threshold: the two thresholds that shape your training
The power of a lactate test lies in identifying two specific thresholds. Neither is a hard cutoff, but together they form the foundation for individual training zones.
The aerobic threshold (LT1)
The aerobic threshold marks the point where lactate first starts to measurably rise above resting level. This typically sits around 1.5 to 2.0 mmol/L, though it varies by individual. This threshold sets the upper limit of what we call zone 2 training: the intensity at which you primarily run on fat burning and develop your aerobic system to its fullest without significant lactate accumulation.
For a trained cyclist, the aerobic threshold might sit around 180 to 200 watts. For a recreational runner, maybe at a pace of 6:00 per kilometer. The point is that these numbers are individual and can’t be guessed based on age, weight or feel alone.
The anaerobic threshold (LT2)
The anaerobic threshold is the point where lactate accumulation accelerates and your body can no longer keep up with clearance. This typically sits around 3.5 to 4.5 mmol/L. This is your functional threshold, the power or pace you can theoretically sustain for 40 to 60 minutes. In cycling terms, this is close to your FTP. For runners, it approximates your 10K race pace.
Why both thresholds matter
The gap between the two thresholds tells you something essential about your profile as an athlete. A large gap (say, an aerobic threshold at 170W and an anaerobic threshold at 280W) points to a well-developed aerobic system with plenty of margin. A small gap suggests your aerobic base is relatively narrow compared to your top-end power.
On top of that, these two thresholds tell you more than a VO2max test alone. VO2max is the ceiling of your oxygen uptake, a useful measure, but it says little about how efficiently you work at submaximal intensities. And that’s exactly where most races and training sessions happen.
How a lactate test works: the protocol step by step
A lactate test follows a standardized step protocol. The test isn’t painful, isn’t exhausting (at least not until the end), and delivers a wealth of data.
Preparation
A reliable test starts with the right preparation:
- No intensive training in the 48 hours before the test
- A light meal 2 to 3 hours before, rich in carbohydrates, not too heavy
- Enough sleep
- No caffeine in the 3 hours before the test (caffeine affects the lactate response)
- The same sports clothing and shoes you’d wear for a normal training session
The step protocol
The test deliberately starts low. On the bike you start around 100 to 120 watts, on the treadmill around 8 to 9 km/h. Each step lasts 4 to 5 minutes, long enough to reach a steady state. After each step, you increase the load by 20 to 30 watts (cycling) or 1 km/h (running).
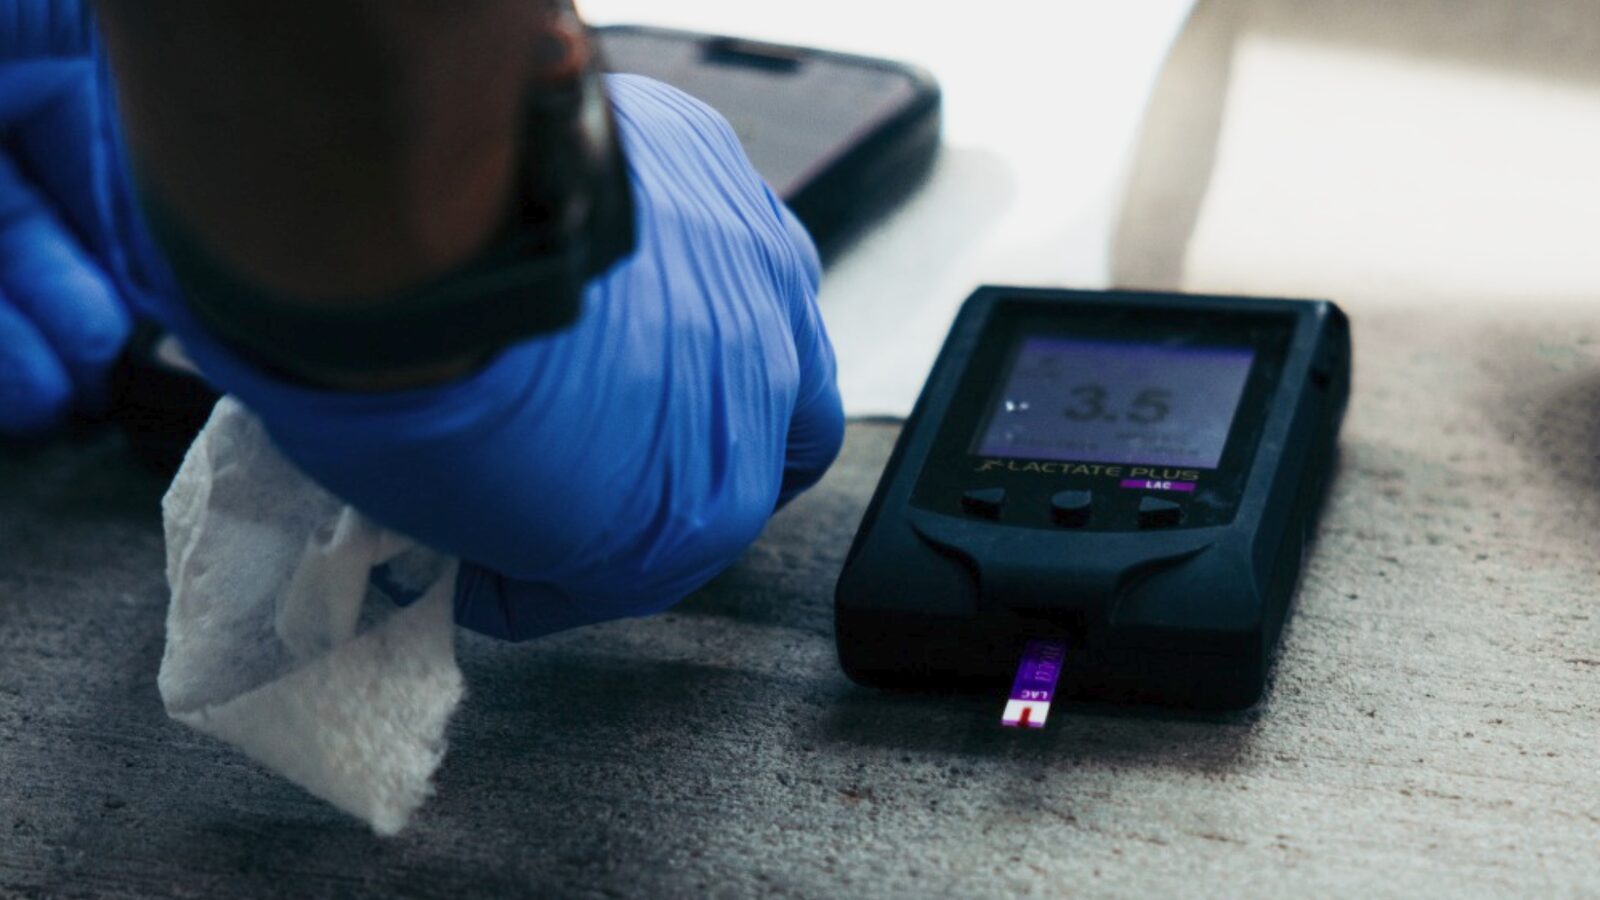
A brief blood sample follows at the end of each step. That sounds more invasive than it is: a small prick in the earlobe or fingertip produces a drop of blood that goes directly onto a test strip. The whole sample takes 15 to 20 seconds. At the same time, you record the average heart rate for that step.
The protocol continues until lactate rises above 8 mmol/L or the athlete can no longer sustain the load. In practice, this means 8 to 12 steps, depending on the athlete’s level.
Practical details
- Duration: 45 to 75 minutes, including warm-up and sampling
- Equipment: a portable lactate meter (such as the Lactate Pro 2 or Lactate Scout), lancets, test strips, a cycling ergometer or treadmill with accurate resistance control, and a heart rate monitor
- Test strip costs: budget 2 to 3 euros per strip, so 20 to 36 euros in material per test at 10 to 12 steps
- Location: in a sports lab, but increasingly also in the field with coaches who have the right equipment
What do you learn from the results?
After the test, you have a dataset with, per step: power (or speed), heart rate and blood lactate. Plotting lactate against power produces the characteristic lactate curve.
Reading the lactate curve
The curve starts flat during the first steps (lactate around 1.0 mmol/L), bends up slightly at the aerobic threshold, and steepens sharply around the anaerobic threshold. The shape of that curve tells you several things:
The position of both thresholds. At what power and heart rate do they sit? That directly determines your training zones. A cyclist with an aerobic threshold at 190W and a heart rate of 138, and an anaerobic threshold at 270W and 164 bpm, now has five to six zones based on real physiology instead of estimates.
Individual training zones. Zones derived from a lactate test are more precise than any other method. Heart rate zones based on maximum heart rate or the Karvonen formula estimate, but a lactate test measures. The difference can be substantial: it’s not unusual for someone’s “zone 2 ceiling” to sit 10 to 15 beats higher or lower than a formula predicts.
Aerobic vs. anaerobic profile. A steep curve (lactate shoots up quickly after the aerobic threshold) points to a relatively weak aerobic foundation. A gradual curve with a high anaerobic threshold indicates strong aerobic capacity. Both profiles call for a different training approach.
Measuring progress. The real power of lactate testing lies in repetition. A cyclist whose anaerobic threshold sits at 260W in January and reaches 280W after 12 weeks of focused training has improved their threshold by nearly 8%. That’s more concrete than “I feel fitter” and gives direction to the next training block. A runner who sees their aerobic threshold shift from 5:30/km to 5:10/km knows their base has gotten stronger, even if the anaerobic threshold hasn’t changed much yet.
Who benefits from a lactate test?
The days when lactate testing was exclusive to professional athletes are over. In practice, a wide range of people benefit directly.
Competitive amateurs who have trained for years by feel or on estimated zones. A single test can explain why certain sessions haven’t delivered the expected results, simply because the zones were off.
Athletes on a plateau. You train consistently, your nutrition is dialed in, but your performance stops improving. A lactate test can show whether your aerobic base is the limiting factor (aerobic threshold too low), or whether you need to work on your top end instead (anaerobic threshold stagnating).
Coaches who want to work evidence-based. A test protocol gives you objective data to base training plans on and to demonstrate the effectiveness of your approach to athletes. No gut feeling, just numbers.
Recreational athletes who want to nail down their zone 2. Growing attention to zone 2 training, partly driven by the work of Peter Attia and Inigo San Millán, has made a large group of health-conscious athletes aware of the importance of aerobic training. But determining zone 2 without a test is mostly guesswork. A lactate test gives you the definitive answer.
Athletes returning from injury. After weeks or months of inactivity, you want to know where you stand. A lactate test gives you an honest baseline without having to guess whether your old zones still apply.
How often should you test?
Testing more isn’t necessarily better. The skill is testing at strategic moments in your season.
Start of season (October/November for cyclists, or the start of your training block). This is your baseline. Where do you stand now? This data forms the foundation for your training plan.
After the base phase, 8 to 12 weeks later. Did the aerobic buildup work? Has the aerobic threshold shifted? This is the moment to adjust course before you build intensity.
Mid-season. Optional, but valuable as a check-in. Especially useful if you have an important goal (a gran fondo, marathon, or triathlon) and want to know if you’re on track.
End of season. Not strictly necessary, but it gives you an endpoint for comparison and helps plan the next season.
For most athletes, 2 to 4 tests per year is optimal. That gives you enough data points to spot trends without turning the protocol into a burden of its own.
From test data to training
A lactate test only becomes valuable once you translate the results into your daily training. And that’s exactly where many athletes and coaches run into a practical problem. You have the data, but how do you make sure that information doesn’t disappear into a spreadsheet?
In Coachbox, you can enter your lactate test results directly, and the software automatically calculates your individual training zones based on your aerobic and anaerobic threshold. Those zones are linked to your daily training data. When you train with a heart rate monitor or power meter, you see immediately which zone every session falls into and whether you actually hit the intended intensity.
It becomes even more valuable with repeat testing. When you log multiple tests over a season, you can compare the lactate curves visually. You see not just that your anaerobic threshold has shifted, but also how the shape of your curve has changed. Has the steepness decreased? Has your aerobic base gotten wider? That visual comparison makes an abstract training effect tangible, both for you as a coach and for the athlete you’re guiding.
For coaches working with multiple athletes, Coachbox lets you generate professional reports. A clear document with the test results, the derived zones and the comparison with previous tests. Reports like that don’t just raise the quality of your coaching, they also build athletes’ trust in the process.
Common mistakes in lactate testing
Even with the right protocol, things regularly go wrong in practice. A few pitfalls to avoid:
Steps that are too short. Steps of 3 minutes don’t give enough time to reach a steady state. The lactate you measure then doesn’t reflect the actual load of that step. Stick to at least 4 minutes, preferably 5.
Sloppy blood sampling. Sweat at the sampling site, too small a drop, or wiping the test strip can all skew the reading. Dry the skin, prick firmly enough for a drop that flows freely, and let the strip draw the blood in.
Ignoring external factors. Lack of sleep, a hard training session the day before, illness in the week leading up to the test: it all affects your lactate response. Always note the conditions so you can put the results in context.
Only looking at the anaerobic threshold. Many athletes and coaches focus exclusively on their threshold. But the aerobic threshold is at least as informative, precisely because it reflects the quality of your aerobic foundation. A rightward shift in the aerobic threshold (more power at the same lactate value) is one of the strongest indicators of aerobic progress.
The lactate test as a compass
A lactate test isn’t an end in itself. It’s a compass that shows you where you stand, where you can go, and which route gets you there most efficiently. Whether you’re a coach guiding ten athletes or an ambitious amateur trying to get the most out of limited training time, the information from a well-executed lactate protocol is irreplaceable.
The combination of the aerobic threshold, the anaerobic threshold, curve analysis and the link to heart rate data gives you a level of insight no other test offers. And it gets even more powerful with repetition: you build a physiological record that shows trends over months and years.
Want to grow your coaching skills? Coachbox Academy offers practice-oriented courses on training methodology, data analysis and coaching in endurance sports.