Own layouts for analyses
Coachbox offers a range of graphs for analyzing workouts and/or periods. Create your own layouts and set them up according to your own preferences. Do you want a layout focused on the analysis of workouts performed with power measurement, or do you prefer a layout specifically for the analysis of swimming workouts.
How can I switch between different layouts?
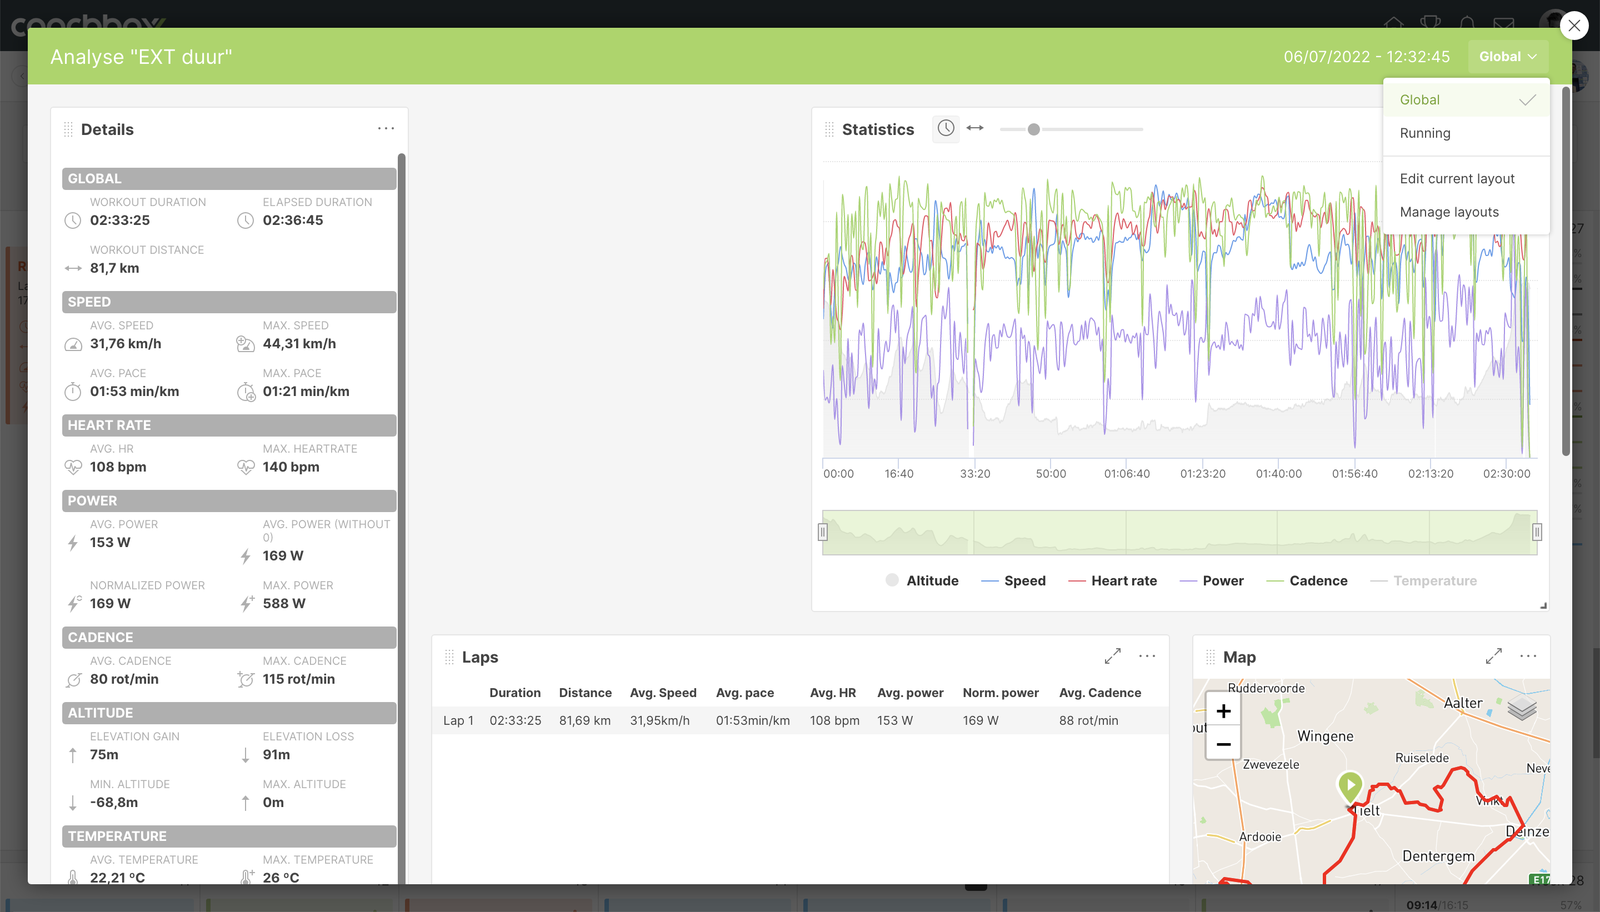
To select a different layout for the analysis of workouts, click on the drop-down menu in the upper right corner of the green bar and choose the desired layout.
To select a different layout for the statistics module, click on the drop-down menu in the upper right corner next to the period selection and choose the desired layout.
How do I add a new layout?
To add a new layout when analyzing a workout, click on the drop-down menu at the top right of the green bar. Then choose 'Manage layouts'.
To add a new layout to the statistics module, click on the drop-down menu in the upper right corner next to the period selection. Then you also choose 'Manage layouts'.
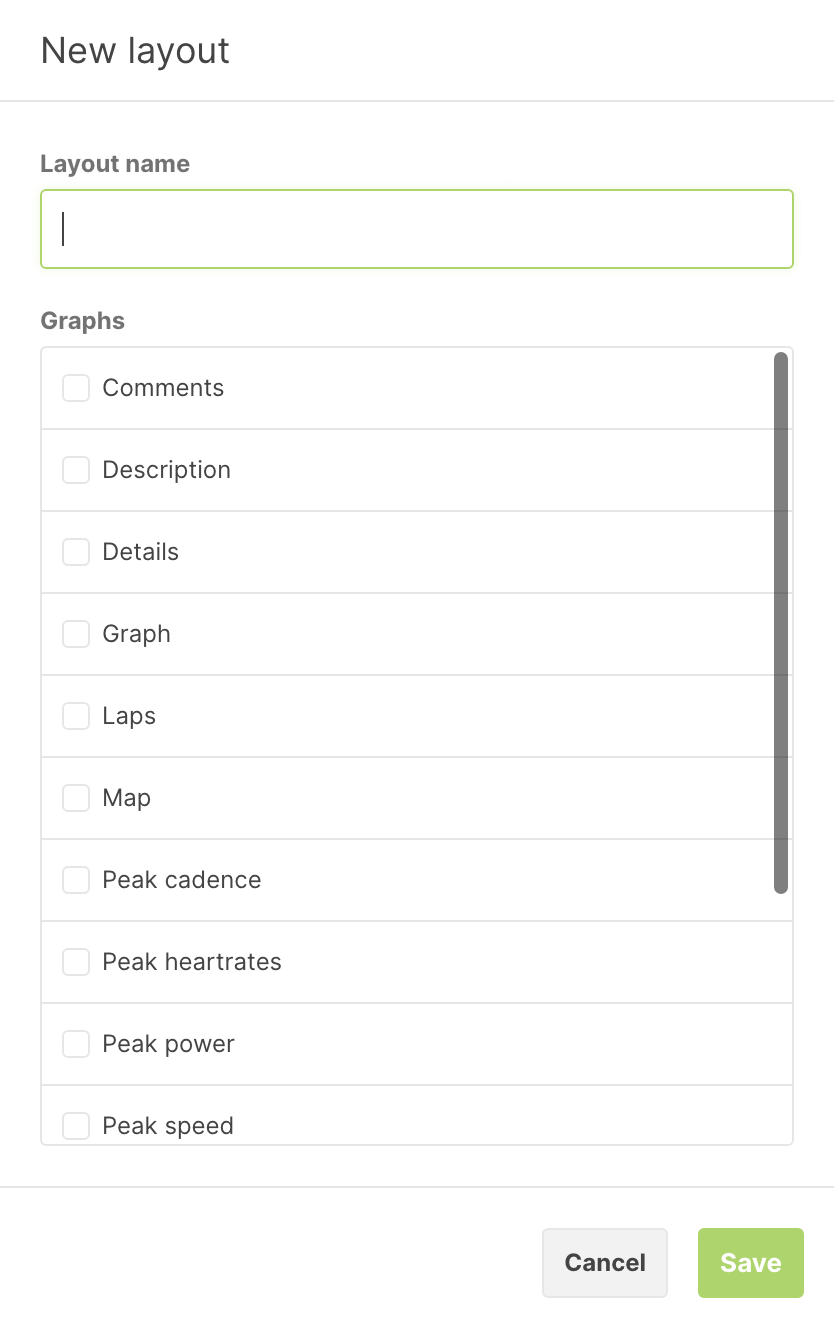
In the next window, click on the button 'Add new layout' in the lower left. In the 'New layout' window, you can enter the desired name for the new layout in the 'Layout name' field. Below this name, you will find the list of available charts. Tick the charts you want to see in the new layout.
After choosing the name and the charts, click on the 'Save' button in the lower right corner. Your new layout has been added and appears in the list of other layouts.
How can I edit a layout?
To edit an existing layout when analyzing a training, click on the drop-down menu at the top right of the green bar. Then select 'Manage layouts' or 'Edit current layout' if you wish to edit the active layout.
To change an existing layout in the statistics module, click on the drop-down menu in the upper right corner next to the period selection. Then you also select 'Manage layouts' or 'Edit current layout' if you wish to edit the active layout.
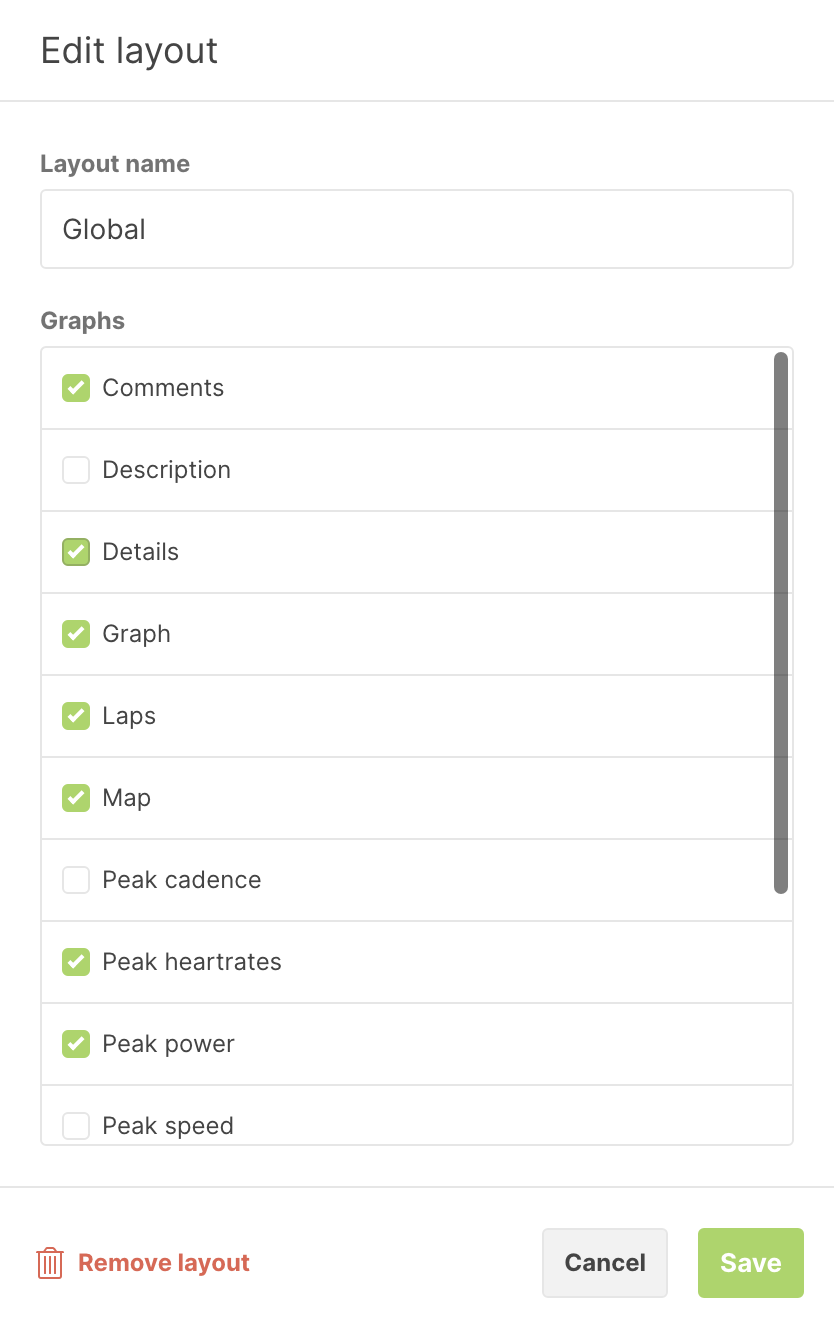
Next, in the window that follows, you click on the icon with the three dots in the list on the right of the layout and choose 'Edit layout'. In the following window, you can change the name for the layout in the 'Layout name' field and, in the list below it, you can check or uncheck the graphs that you wish to use in the layout.
After you have chosen the name and the graphs, click on the 'Save' button in the bottom right. The layout has been modified and appears in the list of other layouts.
How can I delete a layout?
To delete an existing layout when analyzing a training, click on the drop-down menu in the top right corner of the green bar. Then choose 'Manage layouts'.
To remove an existing layout in the statistics module, click on the drop-down menu in the upper right corner next to the period selection. Then also choose 'Manage layouts'.
Then, in the subsequent window, click on the icon with the three dots in the list on the right of the layout and select 'Delete layout'. The layout is removed and is no longer available in the list of other layouts.
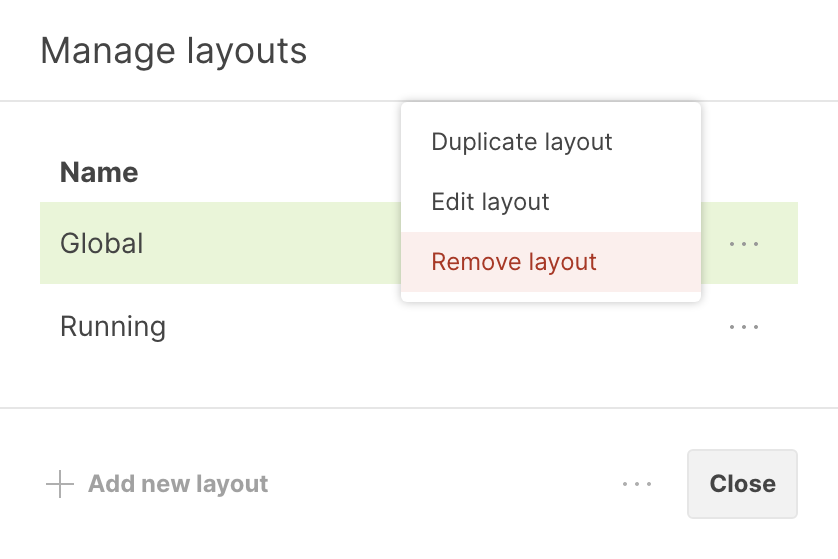
How can I duplicate a layout?
To copy an existing layout when analyzing a training, click on the drop-down menu at the top right of the green bar. Then choose 'Manage layouts'.
To copy an existing layout in the module 'Statistics', click on the drop-down menu in the upper right corner next to the period selection. Then you also choose 'Manage layouts'.
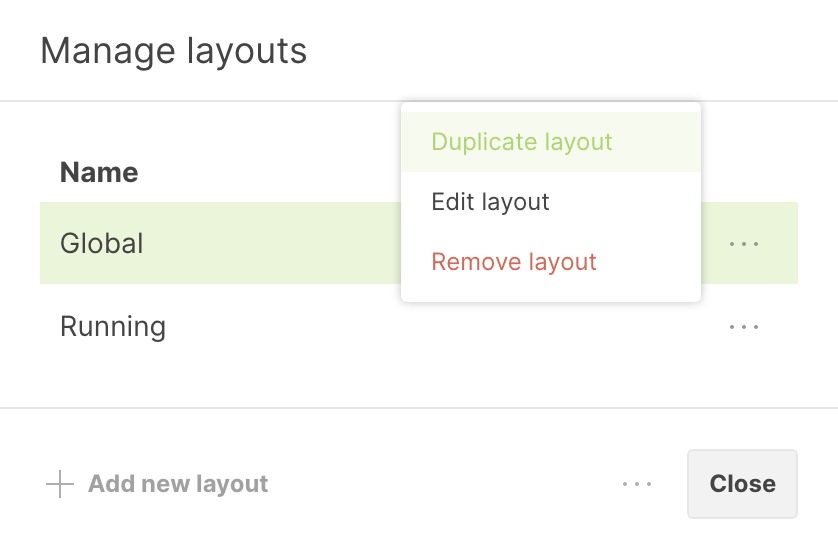
Next, in the window that follows, click on the icon with the three dots in the list on the right of the layout and choose 'Duplicate layout'. In the following window you can enter the name for the new layout in the field 'Layout name' and in the list below you can check or uncheck the graphs that you want to use in the layout.
After you have chosen the name and the desired graphs, click on the 'Save' button in the bottom right. The layout has been modified and appears in the list of other layouts.
How can I position the charts in a layout?
For each graph in a layout you can control its size as well as its positioning to the other graphs.
A chart can easily be dragged by keeping the mouse clicked on the 'drag' icon in the top left corner and dragging it to the desired position. The size of a chart can easily be changed by keeping the mouse clicked on the 'size' icon in the lower right corner and dragging it to the desired size.
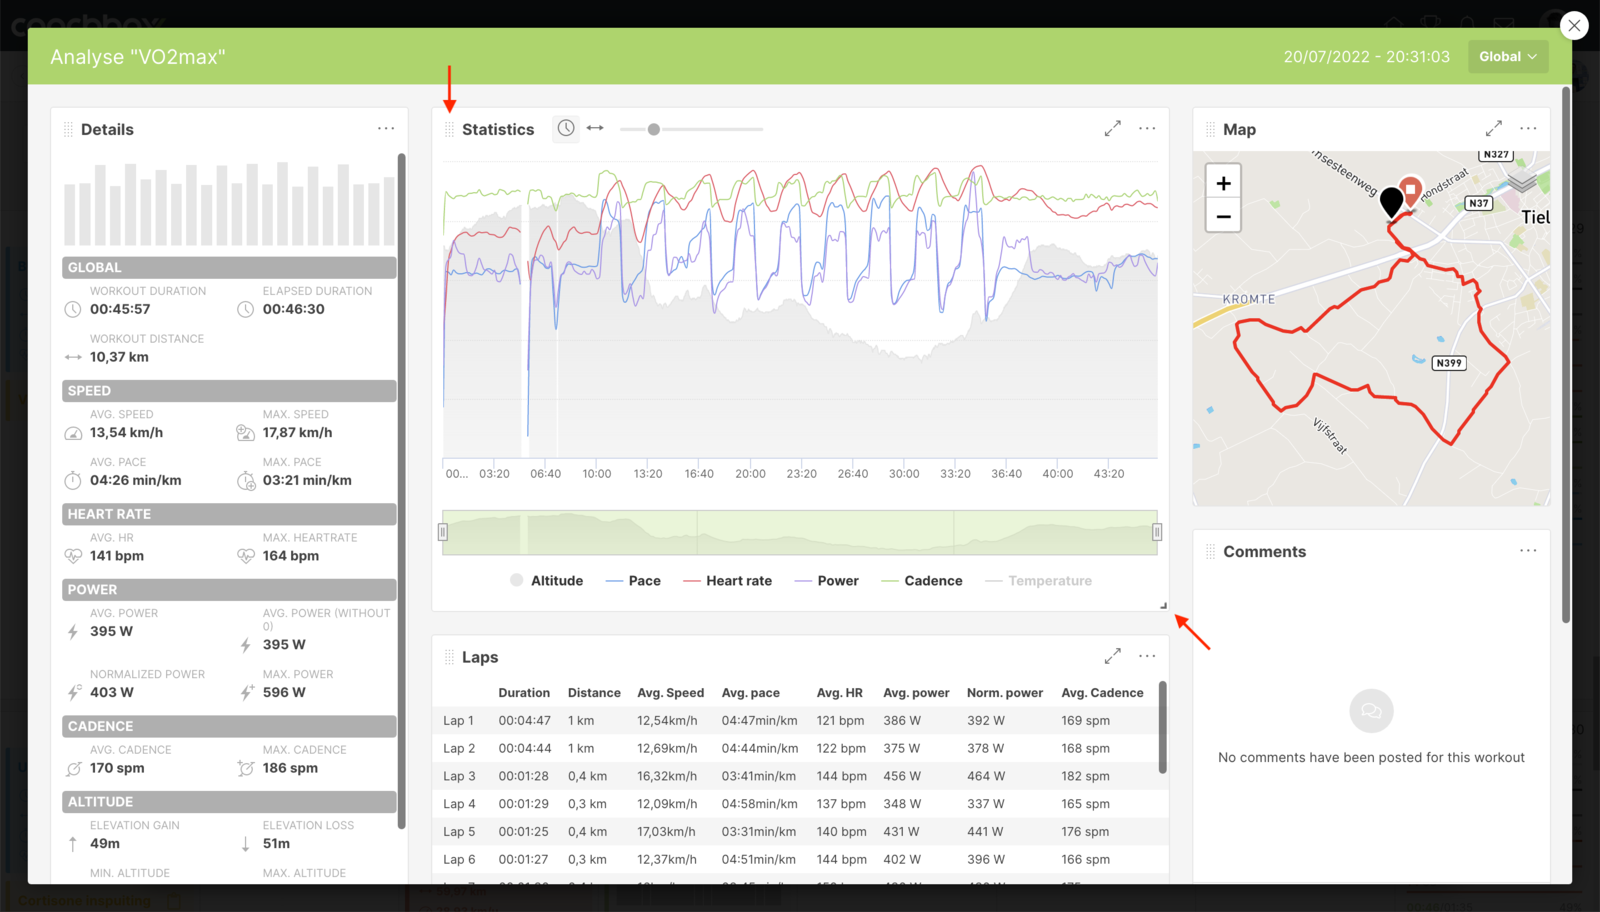
TIP: To adjust specific chart settings, click on the 'options' icon at the top right. Here you can adjust any available options (e.g. time ranges, displayed training types, ...) per chart. Charts can also be viewed full screen by clicking on the 'maximize' icon at the top right.
