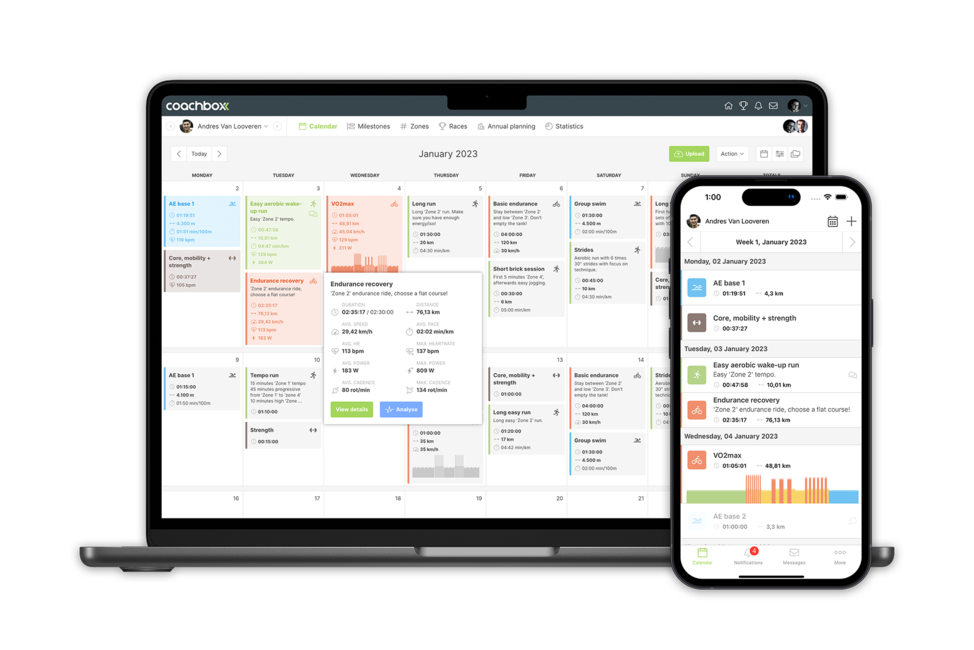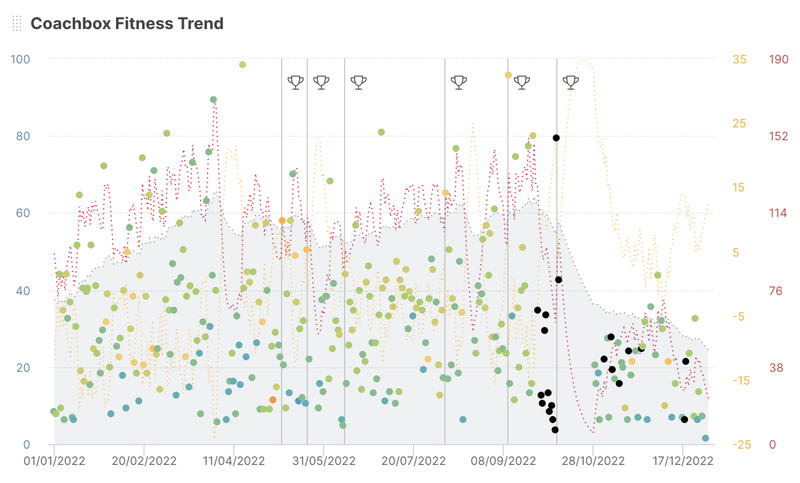
Use our proprietary training load monitoring which we've built and researched together with one of Belgiums' leading sports universities Ugent. Use our integrated Coachbox Fitness Trend to work towards a specific goal and to monitor conditional progression.
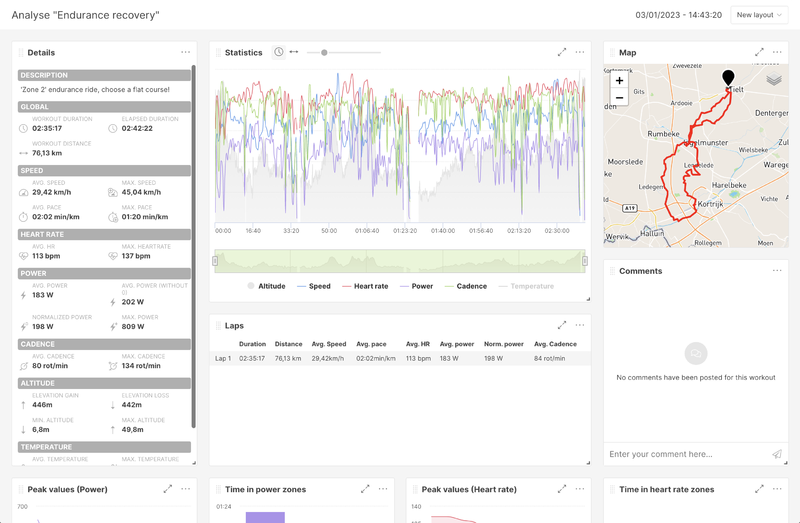
Analyse workouts and review workout data, including but not limited by: heart rate, power, speed, cadence, vertical ratio, vertical oscillation, stride length, stance time, pedal smoothness, left/right balance, grade, swolf, core & skin temperature, route data, etc... View workout data by time or distance to get a better understanding of the workouts' progression.
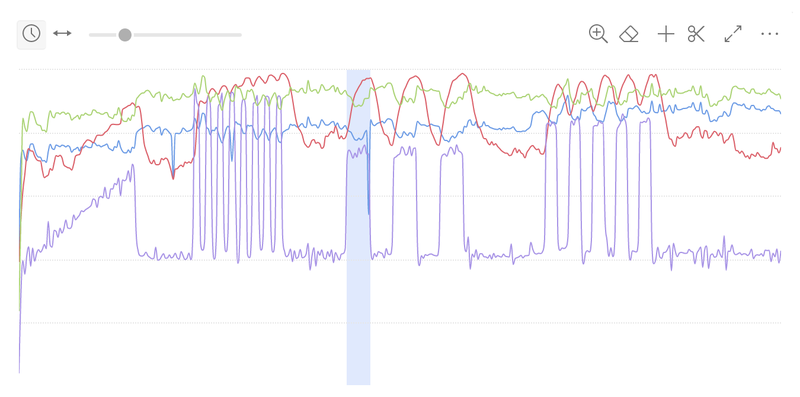
Review automatically imported laps and create custom selections. Store selections to review or compare them at a later moment. Use the zoom button to analyse data in detail or smooth out the graph to get a better general sense of the workouts' progression.
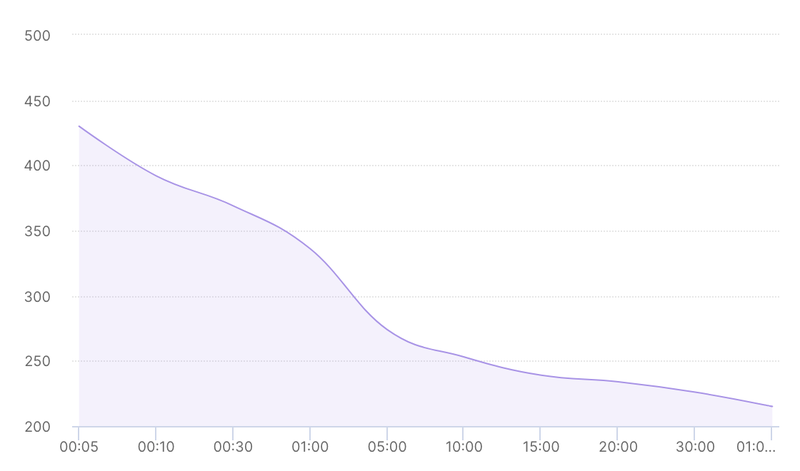
Get a charted overview of time spent in workout zones to review workouts in a better and more efficient way. Analyse your athletes' performance within his/her historical context by using the peak values graph and comparing peaks data with historical peaks data.
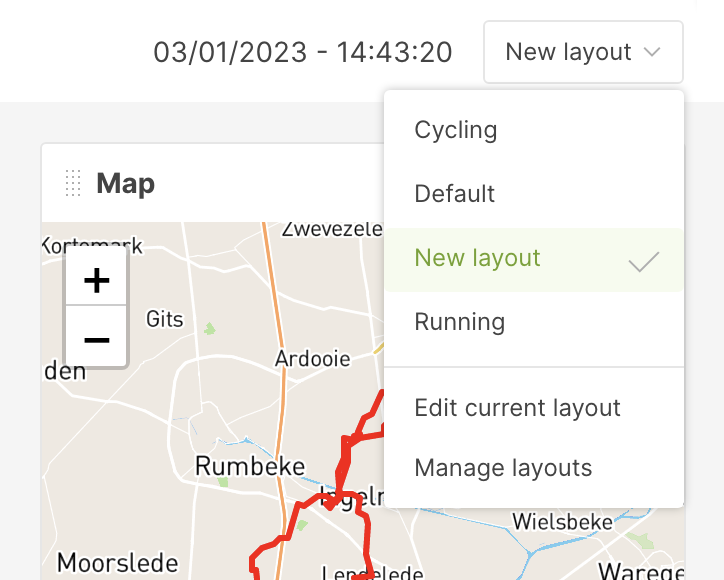
Use our layout builder to choose what data you want to view and remove data panels that are not important to you. Build your custom data dashboard for workout analysis and general period analysis.
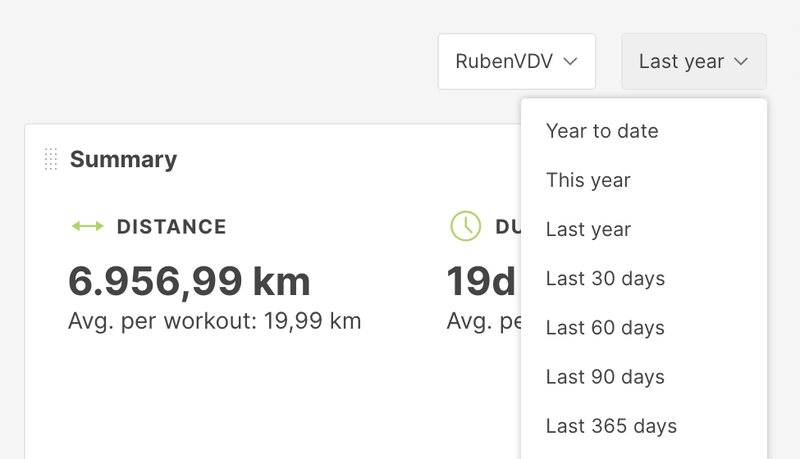
Use the athletes' statistics dashboard to not only view workout analysis but review data over longer periods of time. Compare time spent in zones over longer periods in time with previous periods. Compare time spent per sport for multi-sport athletes like triathletes.
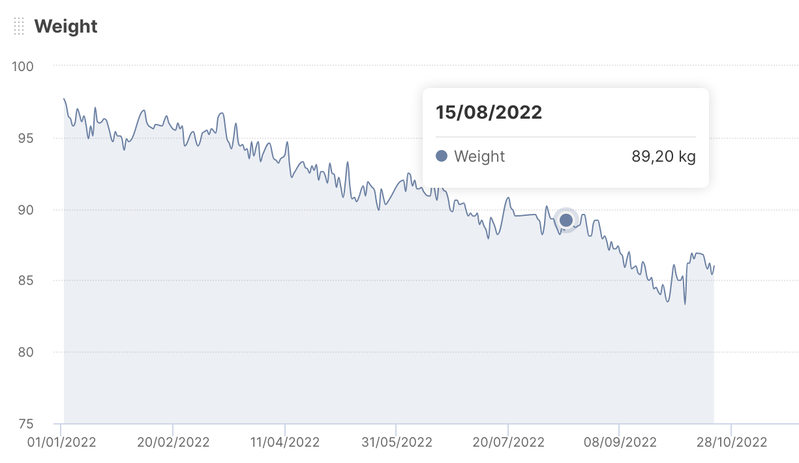
Use the graphs of weight, caloric usage, steps, ... to review larger data periods and view the evolution of an athletes' body measurements.
